 An official website of the United States government
Sexual and reproductive health is a crucial part of adolescents’ overall health and well-being, now and for the rest of their lives. Federal and state departments, large-scale health surveys, public health institutions, academic research studies, and other sources track numerous sexual and reproductive health measures and trends. Their data tell us how adolescents are faring on different sexual and reproductive health measures. Ongoing data reporting, collection, and monitoring allows us to see changes and trends over time (e.g., falling pregnancy and birth rates, rising rates of sexually transmitted infections) and how health outcomes and behaviors vary across groups.
Sexual and reproductive health data is a critical resource for health care professionals, public health agencies, communities, and youth-serving organizations to understand and stay up to date on the health of the young people they serve. This information can also help identify where attention and resources may be needed.
This page provides an overview of key statistics on adolescent sexual and reproductive health, including adolescents’ access to sexual and reproductive health services and areas of disparities.
Learn about the OPA’s vision to eliminate disparities and advance health for all adolescents with Take Action for Adolescents - A Call to Action for Adolescent Health and Well-Being.
Find interactive data tools and other resources to explore publicly available federal data on the characteristics and health, including sexual and reproductive health, of adolescents in the United States.
Adolescent Sexual Behavior and Contraceptive Use
As adolescents develop, they begin to explore romantic and sexual expression and may become sexually active. Decisions about their sexual activity, including decisions to remain abstinent or to use condoms and contraceptives if sexually active, shape adolescent experiences in relationships as well as their exposure to and risk of sexually transmitted infections (STIs) and pregnancy.
According to the 2023 Youth Risk Behavior Survey (YRBS) from the Centers for Disease Control and Prevention (CDC), adolescent sexual activity has declined since 2013. We have also observed declines in condom use and the number of adolescents getting tested for STIs (referred to in the YRBS as sexually transmitted diseases, or STDs) and human immunodeficiency virus (HIV).
Figure 1: Trends in the percentage of high school students’ sexual behavior, 2013–2023
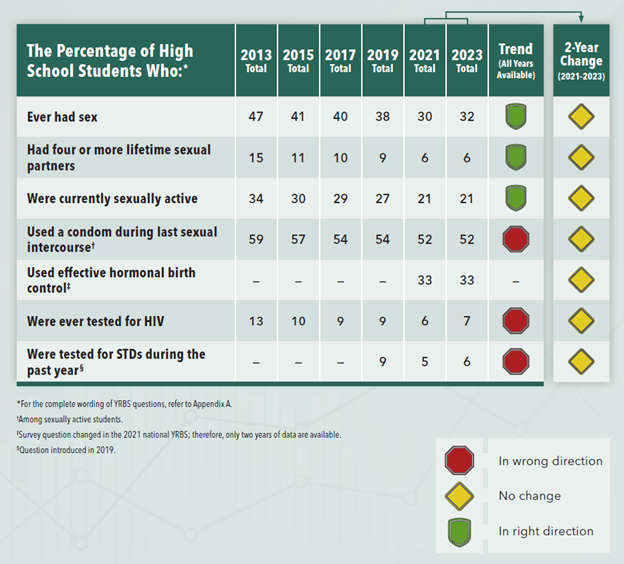
Source: Centers for Disease Control and Prevention Youth Risk Behavior Survey Data Summary & Trends Report: 2013–2023 U.S. Department of Health and Human Services; 2024. https://www.cdc.gov/yrbs/dstr/index.html
There are disparities in these experiences and behaviors across adolescents’ sex, sexual orientation, race and ethnicity, age and other factors. For example, in 2023:
- Reports of being currently sexually active varied by race and ethnicity, from 11% among Asian students to 35% among American Indian or Alaska Native students, and 20–25% across all other groups.
- Female high school students were more likely to be tested for STIs than male students.
Figure 2: Trends in the percentage of high school students who were currently sexually active, 2013–2023
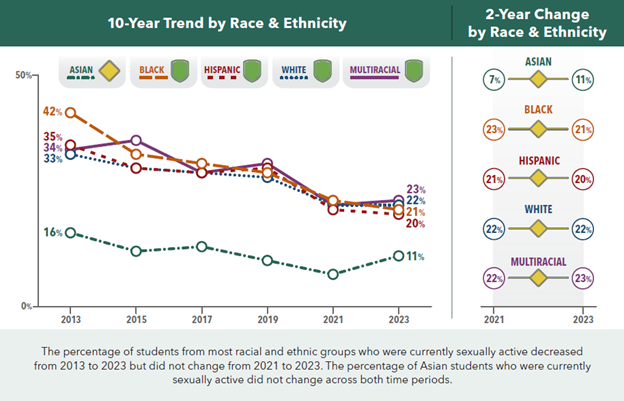
Source: Centers for Disease Control and Prevention Youth Risk Behavior Survey Data Summary & Trends Report: 2013–2023 U.S. Department of Health and Human Services; 2024. https://www.cdc.gov/yrbs/dstr/index.html
Find more data and statistics on adolescent sexual behavior and contraceptive use:
Adolescent Sexually Transmitted Infections (STIs) and HIV
Unprotected sexual activity among adolescents can result in unintended pregnancy or STIs that affect young people’s reproductive and overall health. For example, some STIs, like gonorrhea and chlamydia, not only require care and are transmissible to others but can cause pelvic inflammatory disease (PID). The human papillomavirus (HPV) is the most common STI in the United States and is thought to cause most vaginal, vulvar, cervical, anal, and penile cancers, as well as oropharyngeal (back of the throat) cancers. Adolescents and young adults are overrepresented in the prevalence and risk of STIs.
According to recent data:
- Despite making up 13% of the U.S. population—and about 25% of the sexually active population—young people ages 15–24 accounted for nearly half (48%) of reported cases of chlamydia, gonorrhea, and syphilis (all stages) in 2023.
- Reported rates of certain STIs, such as chlamydia and gonorrhea, are highest among females during adolescence and young adulthood.
- Adolescent females may be more susceptible to infection with some STIs, such as chlamydia, due to differences in the cervix age at that age.
- Prior to the introduction of the HPV vaccine, nearly half of the 14 million new HPV cases each year were among people ages 15–24. In 2023, only 61% of adolescents ages 13–17 were up to date on their HPV vaccine.
- People ages 13–24 accounted for 20% of new HIV diagnoses in 2022.
- Among people ages 13–24 living with HIV in 2022, 44% did not know their HIV status.
In addition to being disproportionately affected by STIs compared to other age groups, there are disparities in STIs among young people. For example, Hispanic, American Indian/Alaska Native, and Black adolescents have higher STI rates than their White peers. Adolescent males who have sex with other males, youth with disabilities, youth with lower socioeconomic status, and other groups face greater risks of STIs. While most people who acquire HIV as adolescents or young adults acquire it through sexual transmission, youth who engage in injection drug use face a higher risk of HIV.
Find more data and statistics on STIs and HIV among adolescents:
- CDC National Center for Health Statistics (NCHS) — Key Statistics from the National Survey of Family Growth (NSFG)
- CDC NCHS — QuickStats
- CDC — STI Statistics
- CDC Youth Risk Behaviors Data Portal
- CDC YRBS Data Explorer
- CDC YRBS — Youth Online High School and Middle School Results
- Title X Family Planning Annual Report
Adolescent Pregnancies and Births
Since 2009, the birth rate for females ages 15–19 in the United States has fallen to a new low every year.1 Still, the U.S. teen birth rate remains higher than that of other high-income countries. Adolescent pregnancies can carry more health risks for the mother and baby, and adolescent parents often face economic and social costs, particularly the mothers.
The CDC's National Center for Health Statistics tracks births and birth rates of all age groups and periodically publishes data on adolescent pregnancies. According to recent data:
- The 2019 teen pregnancy rate was 29.4 pregnancies per 1,000 females ages 15–19, down from 60.8 in 2010.
- The teen birth rate in 2022 was 13.6 births for every 1,000 females ages 15–19, down 2% from 2021 (13.9) and down 78% from the 1991 peak (61.8).1
- The 2022 birth rate for adolescents ages 15–17 was 5.6.1
- The 2022 birth rate for adolescents ages 18–19 was 25.8.1
- Most adolescents who give birth are in their older teens. Of the 143,789 births to females ages 15–19 in 2022, 75% were to mothers ages 18–19.1
- Roughly 14% of live births to 15- to 19-year-olds were the second birth or higher born to the mother.1
Figure 3: Teen Birth Rate, 1950–2022
Number of live births per 1,000 females aged 15 to 19
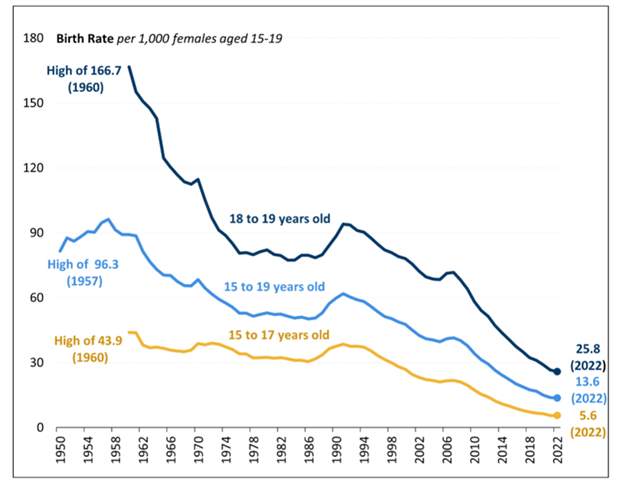
Source: Mickler, K. M., & Tollestrup, J. (2024). Teen Birth Trends: In Brief. CRS Report R45184, Version 8. Updated August 28, 2024. Congressional Research Service. https://crsreports.congress.gov/product/pdf/R/R45184
Adolescent pregnancies and births differ substantially across different groups, such as race and ethnicity, socioeconomic status, geography (regions and states as well as rural versus urban areas), and youth involved in the child welfare system. For example:
- In 2022, teen birth rates of American Indian/Alaska Native, Native Hawaiian/Other Pacific Islander, Black, and Hispanic adolescents were more than double the rate for White adolescents, and more than 10 times higher than the rate among Asian adolescents.1
- While rates are declining for all adolescents, the magnitude of the decline in teen birth rates varies by race and Hispanic origin.1
- U.S. teen birth rates vary by state, with the highest rates in southern states.
- Adolescent birth rates are higher in rural areas than in urban areas.
- Women who had been in foster care were more likely to have had an adolescent birth than those who had not.
Figure 4: Birth rates for females ages 15–19, by race and Hispanic origin of mother, 1990–2022
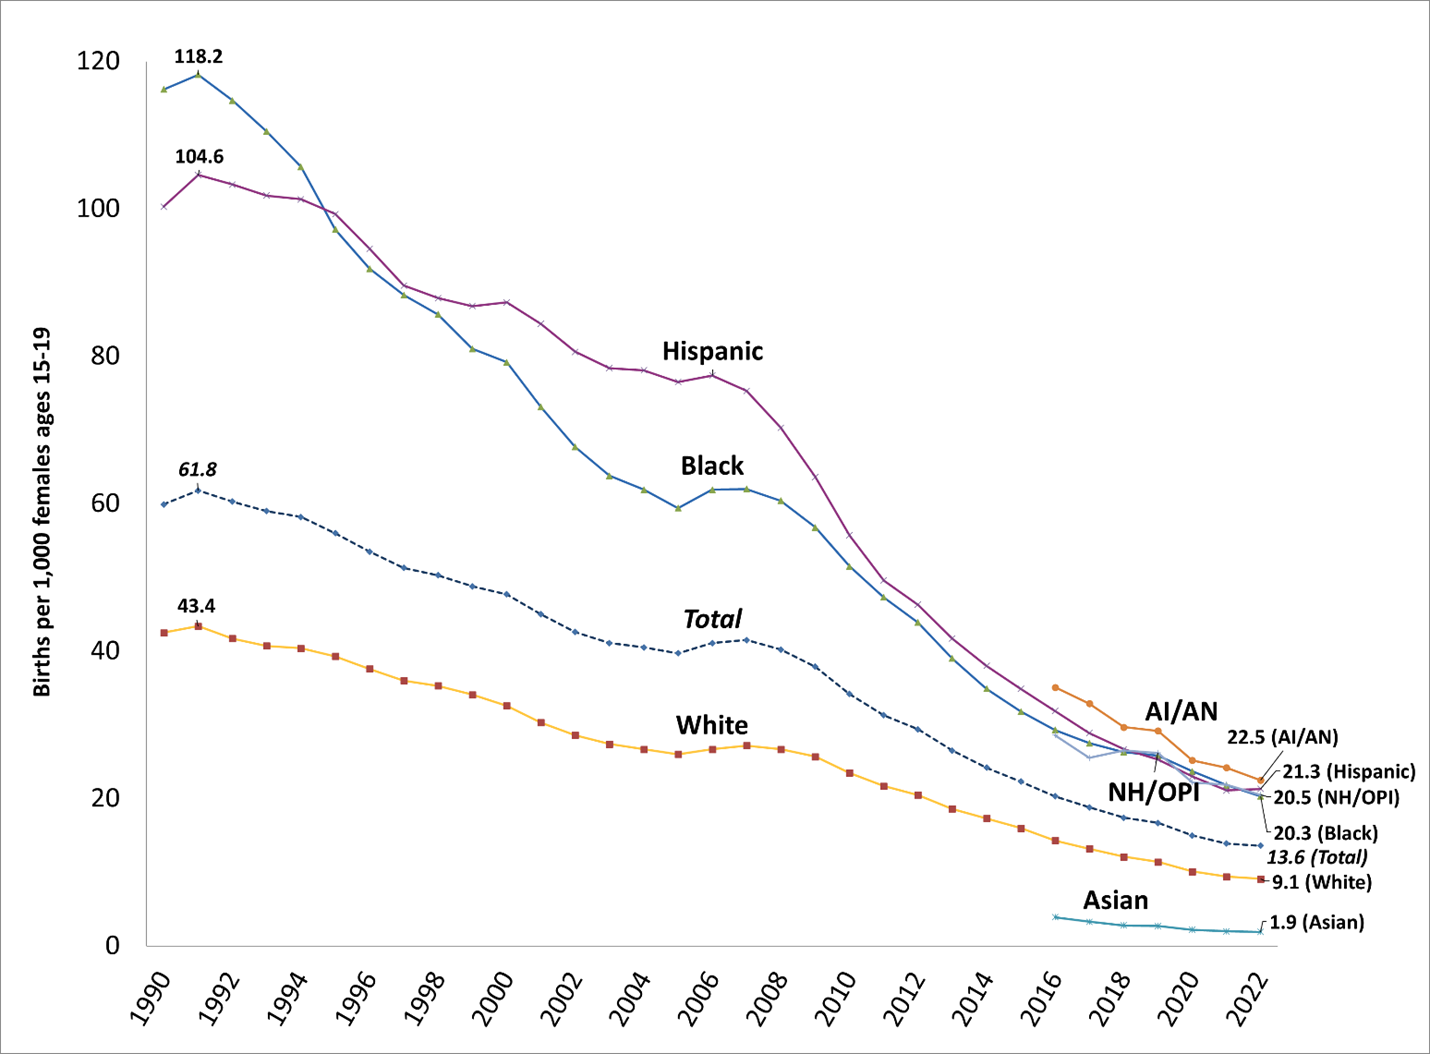
Note: Race categories shown are from published National Center for Health Statistics (NCHS) reports. The categorization method has changed over time. Estimates from before 2016 use different categories consistent with the 1977 Office of Management and Budget (OMB) standards and only present estimates separated by Hispanic origin for Black and White racial groups. Beginning with the 2016 report, the NCHS reports race consistent with the 1997 OMB standards.
Sources:
- For 1990–2015: Centers for Disease Control and Prevention. (2017). Births: Final data for 2015. National Vital Statistics Reports, 66(1). https://www.cdc.gov/nchs/data/nvsr/nvsr66/nvsr66_01.pdf
- For 2016–2020: Centers for Disease Control and Prevention. (2022). Births: Final data for 2020. National Vital Statistics Reports, 70(17). https://www.cdc.gov/nchs/data/nvsr/nvsr70/nvsr70-17.pdf
- For 2021–2022: Centers for Disease Control and Prevention. (2024). Births: Final data for 2022. National Vital Statistics Reports, 73(2). https://www.cdc.gov/nchs/data/nvsr/nvsr73/nvsr73-02.pdf
Despite the declines, some adolescents will get pregnant. It is essential that they have support and access to care. Find resources and services to support expectant and parenting teens.
Find more data and statistics on adolescent pregnancies and births:
How OPA’s Grant Programs Support Adolescent Sexual and Reproductive Health
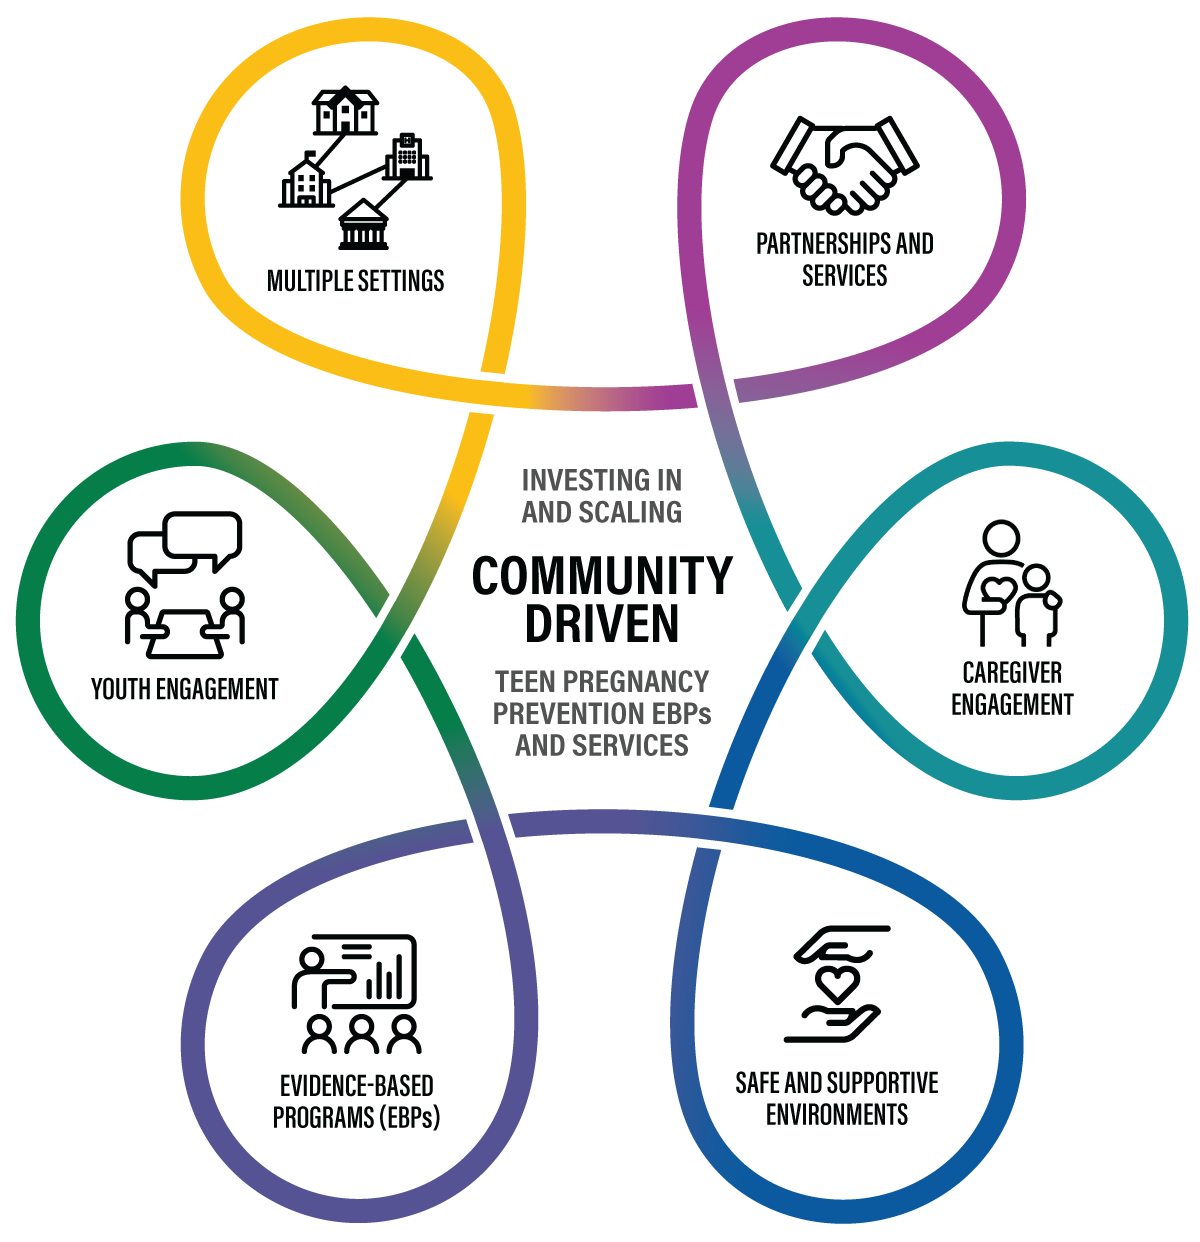
OPA funds organizations nationwide to replicate and scale community-driven evidence-based TPP programs to improve adolescent reproductive health and overall well-being. TPP grant recipients also develop and evaluate new and innovative approaches to preventing teen pregnancy, preventing STIs, and promoting positive youth development. Learn more about the TPP program.
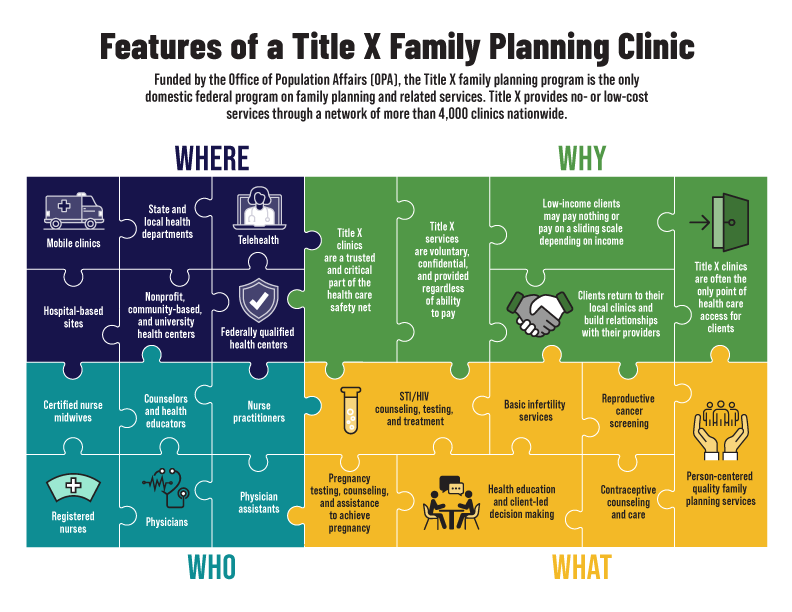
OPA supports a network of Title X grant recipients that provide a wide range of voluntary, client-centered family planning and related preventive services across the country. The Title X family planning program is a critical part of America’s public health safety net, serving as a point-of-entry into care for millions over the program’s more than 50-year history. Learn more about Title X and find a family planning clinic near you.
Footnotes
1 Osterman, M.J.K., Hamilton, B.E., Martin, J.A., Driscoll, A.K., Valenzuela, C.P. (2024). Births: Final data for 2022. (National Vital Statistics Reports Volume 73, Number 2). Centers for Disease Control and Prevention. https://dx.doi.org/10.15620/cdc:145588