Adolescents in the United States reflect the changing racial/ethnic, socioeconomic, and geographic structure of the increasingly diverse U.S. population. If adults who work with youth understand the demographic characteristics and diversity of adolescents, they can do a better job of planning and delivering health services to this population that are accessible and culturally responsive for all adolescents.
Number of Adolescents
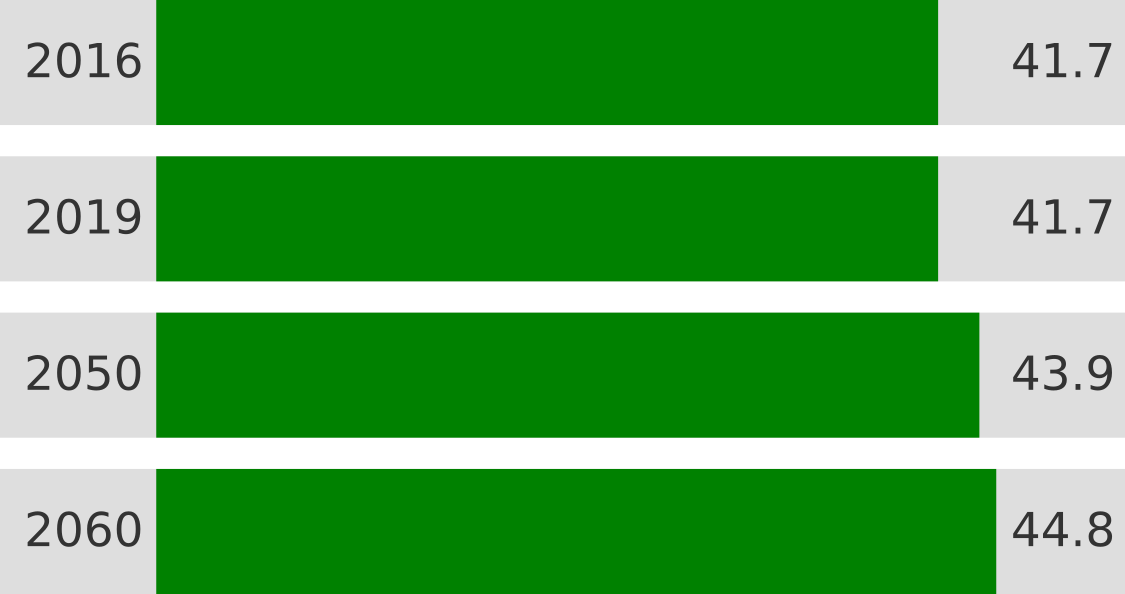
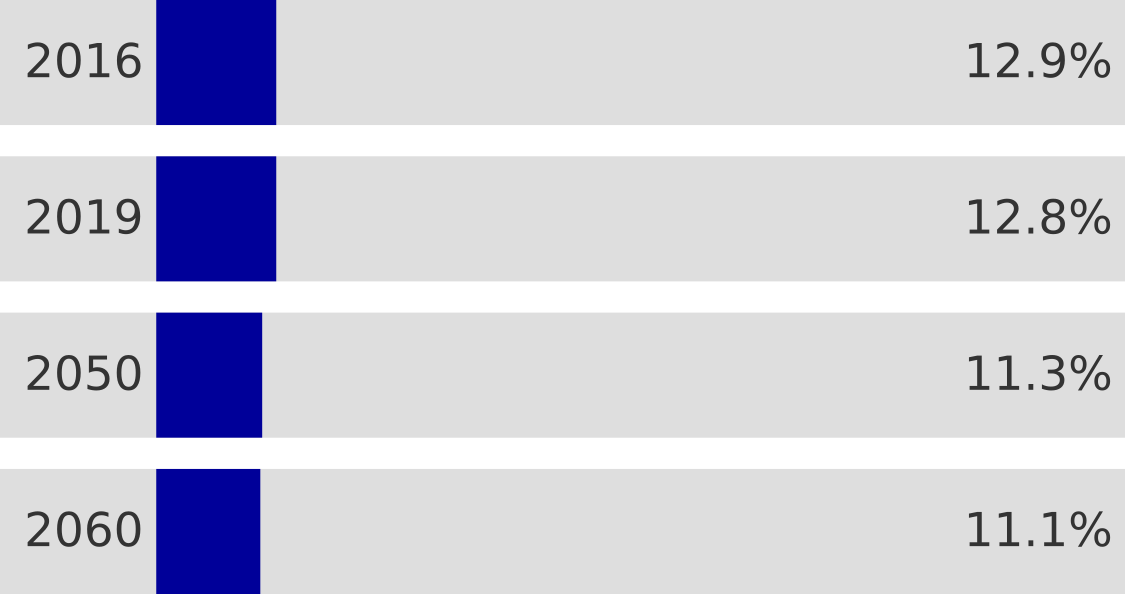
In 2019, there were almost 42 million adolescents between the ages of 10 and 19 in the United States, and adolescents made up 12.8 percent of the population.1 As the U.S. population ages, adolescents will represent an increasingly smaller proportion of the total population. By 2050, population projections from the Census Bureau show that adolescents will make up 11.3 percent of the population, and by 2060, they will be 11.1 percent of the population.2 While adolescents are predicted to represent a smaller portion of the total population, estimates show that the number of adolescents in the population will continue to grow, reaching almost 44 million in 2050 and almost 45 million in 2060.2 Figure 1 below shows these shifts.
Figure 1: The number of U.S. adolescents will continue to grow but adolescents will represent a decreasing percentage of the U.S. population.
Number of U.S. adolescents (in millions)

Percent of U.S. population

Source for 2016, 2050, and 2060 data: U.S. Census Bureau. (2017). Projected 5-year age groups and sex composition: Main projections series for the United States, 2017-2060. Washington, DC: U.S. Census Bureau, Population Division. Retrieved from https://www2.census.gov/programs-surveys/popproj/tables/2017/2017-summary-tables/np2017-t3.xlsx
Source for 2019 data: U.S. Census Bureau. (2020). Current Population Survey, Annual Social and Economic Supplement, 2019. Washington, DC: U.S. Census Bureau, Population Division. Retrieved from https://www2.census.gov/programs-surveys/demo/tables/age-and-sex/2019/age-sex-composition/2019gender_table1.xlsx
Race and Ethnicity
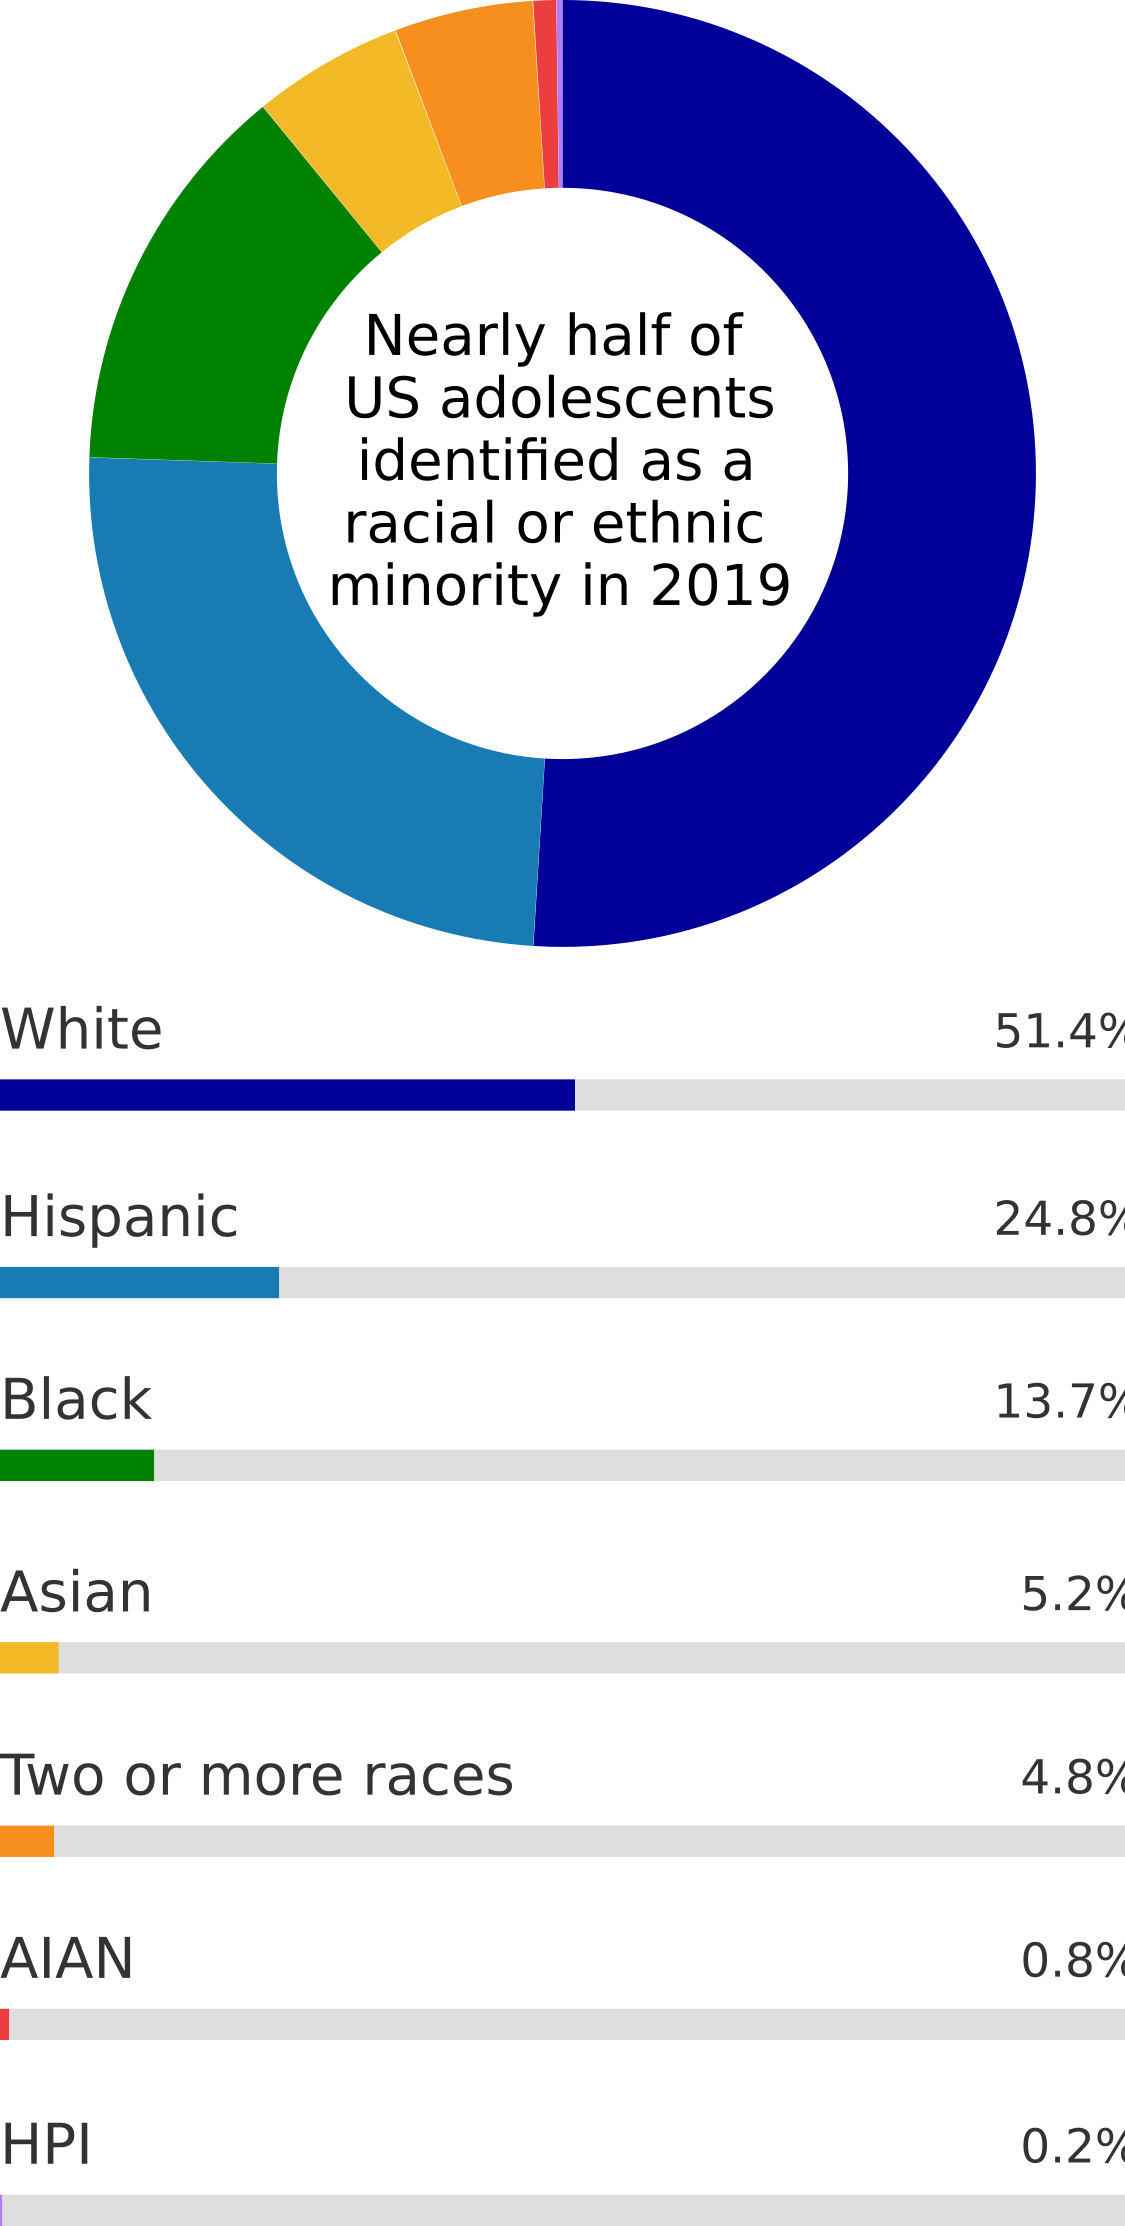
Nearly half of U.S adolescents in 2019 identified as a racial or ethnic minority. In 2019, just over half of U.S. adolescents (51 percent) identified as white, and the remaining 49 percent identified as Hispanic (of any race; 25 percent), black (14 percent), Asian (5 percent), two or more races (5 percent), American Indian Alaska Native (1 percent), or Native Hawaiian Pacific Islander (less than 1 percent).3 This is important because large disparities by race and ethnicity continue to exist across a number of health domains and outcomes.
Figure 2: Race/ethnicity of America’s adolescents

Notes: Hispanics/Latinos can be of any race. As listed, all race categories, except for Hispanic and multiracial, exclude Hispanics/Latinos. AIAN stands for American Indian Alaska Native. HPI stands for Hawaiian or Other Pacific Islander.
Source: U.S. Census Bureau. (2020). Annual Estimates of the Resident Population by Sex, Age, Race, and Hispanic Origin for the United States: April 1, 2010 to July 1, 2019 (NC-EST2019-ASR6H). Retrieved from https://www.census.gov/newsroom/press-kits/2020/population-estimates-detailed.html
Differences by race/ethnicity in access to health care, health-related behavior, and health outcomes are well documented. In general, many members of racial and ethnic minority groups, most consistently black and American Indian Alaska Native populations, have poorer access to health care, receive worse health care, experience more serious health conditions – in part due to poor access to health care and the quality of health care received, and have higher mortality rates than the national average.4,5,6
Within the research and public health fields, a recent focus on the social determinants of health highlights the importance of the environments where adolescents live, play, study, and work and the influence of these environments on adolescents’ health and well-being. Poverty is one such environment that is linked to poorer health, and racial and ethnic disparities in access to and quality of health care, health condition status, and mortality, in part, reflect higher poverty rates among racial and ethnic minority groups.7,8,9,10 Additionally, racism may shape racial and ethnic minority adolescent health; members of racial and ethnic minority groups may receive worse health care in part because of health care providers’ implicit bias and racism.11
Health professionals can improve the delivery of services to minority youth by incorporating culturally informed practices and by incorporating an understanding of social determinants into their care.12,13,14,15,16 Health equity among the diverse adolescent population will be impossible to achieve if racial and ethnic disparities are not addressed.
Socioeconomic Status
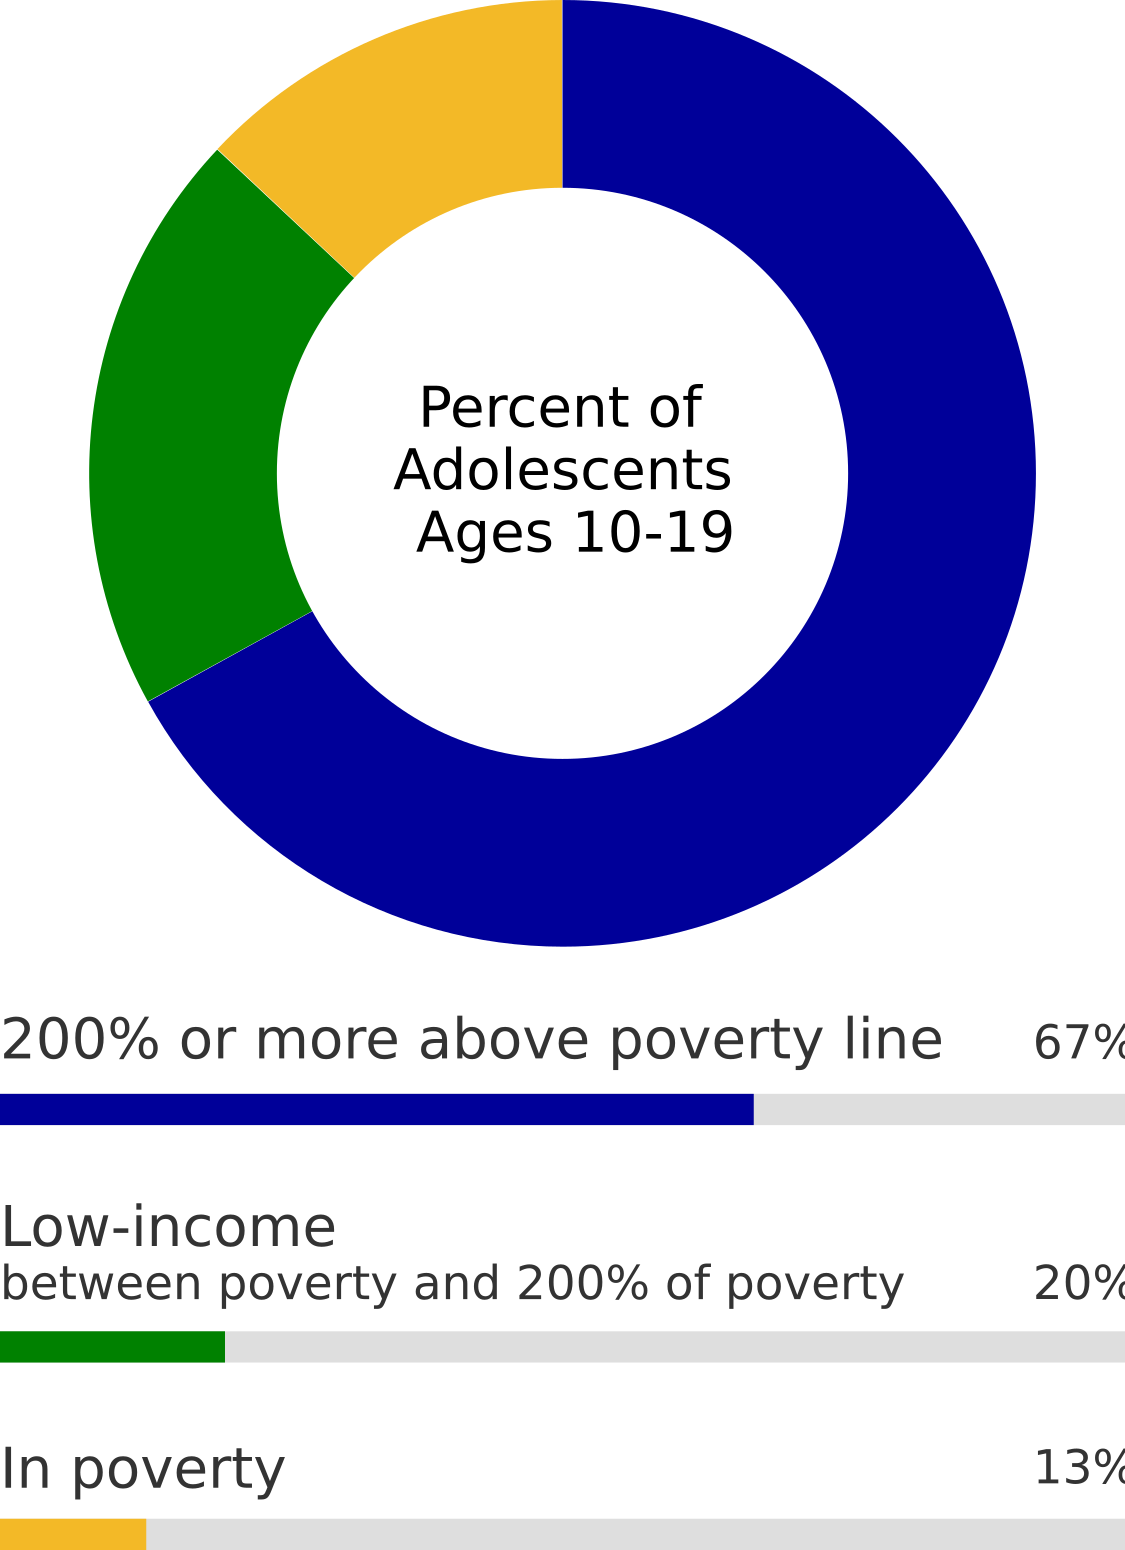
Poverty is a reality for many adolescents in the United States. In 2019, approximately one in three adolescents (33 percent) were living in families at less than twice the federal poverty line.17 Almost one in seven adolescents (13.3 percent) were living in families with incomes below the federal poverty line (defined as an income of $25,750 or less for a family of four in 2019).17,18 This means that out of all adolescents in low income families in 2019, approximately 40 percent lived in poverty.17 Poverty rates were especially high for single-female headed families.19
Growing up in poverty can have negative health implications for adolescents. Compared to adolescents in higher income families, adolescents in lower income families have worse academic outcomes.20 These adolescents are also more likely to suffer from behavioral or emotional problems and engage in unhealthy behavior, such as eating unhealthy diets, physical inactivity, smoking, and early initiation of sexual activity.7,21,22,23 Poverty is a social determinant of health and academic outcomes in part because it shapes adolescents’ access to well-funded schools, healthy food, and safe outdoor spaces.24,25
Figure 3: Income status of America’s adolescents

Notes: Data are not available for youth in foster care or those under the age of 15 living with non-relatives. In 2019, the federal poverty line was defined as $25,750 for a family of four.
Source: Semega, J., Kollar, M., Creamer, J., and Mohanty, A. (2020). U.S. Census Bureau, Current Population Reports: Income and poverty in the United States: 2018 (P60-266(RV)). U.S. Government Printing Office, Washington D.C. Retrieved from https://www.census.gov/content/dam/Census/library/publications/2019/demo/p60-266.pdf.
Geographic Location
In 2019, many parts of the country saw decreases in the population under 18 years old– particularly the northeast. However, other parts of the country saw increases – such as in North and South Dakota, Alaska, Hawai’i, and Florida.26 Within all states, whether adolescents live in rural or urban areas affects their health behavior and the availability of health services. Most adolescents in the United States live in or just outside an urban area.27 In 2014, the most recent year data are available, 15- to 17-year-olds in rural areas reported being the victim of a violent crime - including rape, sexual assault, robbery, aggravated or simple assault, or threats of these crimes - at rates nearly four times higher than those in urban and suburban areas. Among younger (12- to 14-year-olds) and older adolescents (18- to 20-year-olds), the rates were similar in rural, urban, and suburban areas.28 Additionally, those living in urban areas are more likely than their rural counterparts to have access to playgrounds, community or recreation centers, and parks.27
More than four million adolescents live in rural areas. Rural adolescents are more likely to live in low-income households than adolescents in urban areas.27 While children living in urban and rural areas are equally likely to have health insurance,27 rural youth are more likely to rely on CHIP or Medicaid and they often face barriers to accessing health services due to a shortage of providers, financial constraints, lack of internet access, and transportation challenges.29 Moreover, mental health services are notably limited in rural areas.30,31,32 Youth in rural areas, compared to youth in urban areas, are more likely to be overweight or obese and to live with someone who smokes.27 Youth in rural areas also have higher suicide rates and are more likely to misuse opioids.32,33 However, rural youth (particularly those in small rural areas[i]) are more likely than other youth to live in supportive communities and share a meal with their family every day of the week.27
Figure 4: Where adolescents live

Note: 315,000 adolescents live in areas that are not identifiable and about 4.4 million live in metro areas with unknown central city status; together approximately 4.5 million are not included.
Source: Semega, J., Kollar, M., Creamer, J., and Mohanty, A. (2020). U.S. Census Bureau, Current Population Reports: Income and poverty in the United States: 2018 (P60-266(RV)). U.S. Government Printing Office, Washington D.C. Retrieved from https://www.census.gov/content/dam/Census/library/publications/2019/demo/p60-266.pdf.
Footnotes
[i] Small rural areas refer to small towns and isolated rural areas with populations of 2,500-9,999 persons and their surrounding areas.
1 U.S. Census Bureau. (2020). Current Population Survey, Annual Social and Economic Supplement, 2019. Washington, DC: U.S. Census Bureau, Population Division. https://www2.census.gov/programs-surveys/demo/tables/age-and-sex/2019/age-sex-composition/2019gender_table1.xlsx back to top
2 U.S. Census Bureau. (2017). Projected 5-year age groups and sex composition: Main projections series for the United States, 2017-2060. Washington, DC: U.S. Census Bureau, Population Division. https://www2.census.gov/programs-surveys/popproj/tables/2017/2017-summary-tables/np2017-t3.xlsx back to top
3 U.S. Census Bureau. (2020). Annual estimates of the resident population by sex, age, race, and Hispanic origin for the United States: April 1, 2010 to July 1, 2019 (NC-EST2019-ASR6H). https://www.census.gov/newsroom/press-kits/2020/population-estimates-detailed.html back to top
4 National Academies of Sciences, Engineering, and Medicine. (2019). The Promise of Adolescence: Realizing Opportunity for All Youth. Washington, DC: The National Academics Press. https://doi.org/10.17226/25388 back to top
5 Centers for Disease Control and Prevention. (2021). National Vital Statistics Reports: Deaths: Final data for 2018 (Volume 69, No. 13). Hyattsville, MD: National Center for Health Statistics. https://stacks.cdc.gov/view/cdc/100479 back to top
6 Richardson, A., Allen, J. A., Xiao, H., & Vallone, D. (2012). Effects of race/ethnicity and socioeconomic status on health information-seeking, confidence, and trust. Journal of Health Care for the Poor and Underserved, 23(4), 1477–1493. back to top
7 Peverill, M., Dirks, M. A., Narvaja, T., Herts, K. L., Comer, J. S., & McLaughlin, K. A. (2021). Socioeconomic status and child psychopathology in the United States: A meta-analysis of population-based studies. Clinical Psychology Review, 83, 101933. https://doi.org/10.1016/j.cpr.2020.101933 back to top
8 Towne, S. D., Probst, J. C., Hardin, J. W., Bell, B. A., & Glover, S. (2017). Health & access to care among working-age lower income adults in the Great Recession: Disparities across race and ethnicity and geospatial factors. Social Science & Medicine, 182(1), 30–44. https://doi.org/10.1016/j.socscimed.2017.04.005 back to top
9 Armstrong, S., Wong, C. A., Perrin, E., Page, S., Sibley, L., & Skinner, A. (2018). Association of physical activity with income, race/ethnicity, and sex among adolescents and young adults in the United States: Findings from the National Health and Nutrition Examination Survey, 2007-2016. JAMA Pediatrics, 172(8), 732–740. https://doi.org/10.1001/jamapediatrics.2018.1273 back to top
10 Assari, S., Caldwell, C. H., & Bazargan, M. (2019). Association between parental educational attainment and youth outcomes and role of race/ethnicity. JAMA Network Open, 2(11), e1916018. https://doi.org/10.1001/jamanetworkopen.2019.16018 back to top
11 Trent, M. Dooley, D. G., and Dougé, J. (2019). The Impact of Racism on Child and Adolescent Health. Pediatrics, 144(2). https://doi.org/10.1542/peds.2019-1765 back to top
12 Ladha, T., Zubairi, M., Hunter, A., Audcent, T., & Johnstone, J. (2018). Cross-cultural communication: Tools for working with families and children. Paediatrics & Child Health, 23(1), 66–69. https://doi.org/10.1093/pch/pxx126 back to top
13 American Academy of Pediatrics. (2021). Engaging patients and families: Providing culturally effective care – a toolkit. https://www.aap.org/en-us/professional-resources/practice-transformation/managing-patients/Pages/effective-care.aspx back to top
14 O'Keefe V.M., Cwik M.F., Haroz E.E., & Barlow A. (2021). Increasing culturally responsive care and mental health equity with indigenous community mental health workers. Psychological Services. 18(1), 84-92. https://pubmed.ncbi.nlm.nih.gov/31045405/ back to top
15 Bernard, D.L., Calhoun, C.D., Banks, D.E., Halliday, C.A., Hughes-Halbert, C., & Danielson, C. K. (2020) Making the "C-ACE" for a Culturally-Informed Adverse Childhood Experiences framework to understand the pervasive mental health impact of racism on Black youth. Journal of Child and Adolescent Trauma, 14(2), 233-247. https://pubmed.ncbi.nlm.nih.gov/33986909/ back to top
16 Jongen, C., McCalman, J., & Bainbridge, R. (2018). Health workforce cultural competency interventions: A systematic scoping review. BMC Health Services Research, 18, 232. https://www.ncbi.nlm.nih.gov/pmc/articles/PMC5879833/pdf/12913_2018_Article_3001.pdf back to top
17 Child Trends’ analysis of the CPS dataset. [Flood, S., King, M., Rodgers, R., Ruggles, S, and Warren, J.R. (2021) Integrated Public Use Microdata Series, Current Population Survey: Version 8.0 [2020, dataset]. Minneapolis, MN: IPUMS.] https://doi.org/10.18128/D030.V8.0 back to top
18 Office of the Assistant Secretary for Planning and Evaluation. (n.d). 2019 Poverty Guidelines. https://aspe.hhs.gov/2019-poverty-guidelines back to top
19 Semega, J., Kollar, M., Creamer, J., and Mohanty, A. (2020). U.S. Census Bureau, Current Population Reports: Income and poverty in the United States: 2018 (P60-266(RV)). U.S. Government Printing Office, Washington D.C. https://www.census.gov/content/dam/Census/library/publications/2019/demo/p60-266.pdf back to top
20 National Center for Education Statistics. (2020). Public high school 4-year adjusted cohort graduation rate (ACGR), by race/ethnicity and selected demographic characteristics for the United States, the 50 states, and the District of Columbia: School year 2018-19 [Data set]. https://nces.ed.gov/ccd/tables/acgr_re_and_characteristics_2018-19.asp back to top
21 Pampel, F. C., Kreueger, P. M., & Denney, J. T. (2010). Socioeconomic disparities in health behaviors. Annual Review of Sociology, 36, 349–370. https://www.ncbi.nlm.nih.gov/pmc/articles/PMC3169799/ back to top
22 Centers for Disease Control and Prevention. (2019). Youth and tobacco use. https://www.cdc.gov/tobacco/php/data-statistics/youth-data-tobacco/ back to top
23 Jordahl, T., & Lohman, B. J. (2009). A bioecological analysis of risk and protective factors associated with early sexual intercourse of young adolescents. Children and Youth Services Review, 31(12), 1272–1282. https://doi.org/10.1016/j.childyouth.2009.05.014 back to top
24 Mathewson, T. G. (2020). New data: Even within the same district some wealthy schools get millions more than poor ones. https://hechingerreport.org/new-data-even-within-the-same-district-some-wealthy-schools-get-millions-more-than-poor-ones back to top
25 Kane, J. W. & Tomer, A. (2019). Parks make great places, but not enough Americans can reach them. https://www.brookings.edu/blog/the-avenue/2019/08/21/parks-make-great-places-but-not-enough-americans-can-reach-them/ back to top
26 U.S. Census Bureau. (2020). The next generation: Percent change among the under 18 population: 2010 to 2019. Washington, DC, U.S. Census Bureau, Census Infographics and Visualizations. https://www.census.gov/library/visualizations/2020/comm/map-popest-under-18.html back to top
27 U.S. Department of Health and Human Services. (2015). The health and well-being of children in rural areas: A portrait of the nation, 2011-2012. Rockville, Maryland: U.S. Department of Health and Human Services, Health Resources and Services Administration, Maternal and Child Health Bureau. https://mchb.hrsa.gov/sites/default/files/mchb/data-research/nsch-health-well-child-rural-04-2015.pdf back to top
28 Office for Victims of Crime. (2017). 2017 NCVRW resource guide: Urban and rural victimization fact sheet. Washington, DC: Office for Victims of Crime, Office of Justice Programs, U.S. Department of Justice. https://ovc.ojp.gov/sites/g/files/xyckuh226/files/pubs/OVC_Archives/ncvrw/2017/images/en_artwork/Fact_Sheets/2017NCVRW_UrbanRural_508.pdf back to top
29 Ferdinand, A. O., Johnson, L., Speights, J. S. B., Taite, S. M., Myers, K., Speights, A., & Bellamy, G. (2015). Access to quality health services in rural areas – primary care: A literature review. In J. N. Bolin, G. Bellamy, A. O. Ferdinand, B. A. Kash, & J. W. Helduser (Eds.), Rural healthy people 2020: A companion document to healthy people 2020 (Vol. 1, pp. 11–24). Southwest Rural Health Research Center, Texas A&M Health Science Center School of Public Health. http://pubmed.ncbi.nlm.nih.gov/25953431/ back to top
30 Miller, B., Baptist, J., & Johannes, E. (2018). Health needs and challenges of rural adolescents. Rural Remote Health, 18(3), 4325. doi: 10.22605/RRH4325. https://pubmed.ncbi.nlm.nih.gov/30070896/ back to top
31 Fontanella, C. A., Hiance-Steelesmith, D. L., Phillips G. S., Bridge, J. A., Lester, N., Sweeney, H. A., & Campo, J. V. (2015). Widening rural-urban disparities in youth suicides, United States, 1996-2010. JAMA Pediatrics 169(5), 466-473. https://pubmed.ncbi.nlm.nih.gov/25751611/ back to top
32 Steelesmith, D. L., Fontanella, C. A., Campo, J. V., Bridge, J. A., Warren, K. L., & Root, E. D. (2019). Contextual factors associated with county-level suicide rates in the United States, 1999 to 2016. JAMA Network Open, 2(9), e1910936. https://pubmed.ncbi.nlm.nih.gov/31490540/ back to top
33 Monnat, S. M., & Rigg, K. K. (2016). Examining rural/urban differences in prescription opioid misuse among US adolescents. The Journal of Rural Health, 32(2), 204-218. https://pubmed.ncbi.nlm.nih.gov/26344571/ back to top
 An official website of the United States government